Harvard's Climate Initiative
COMMIT > ACT > THRIVE
2022 Greenhouse Gas Inventory Report for the Town of Harvard
by Bentley University
Published: February 16, 2026
The Greenhouse Gas Inventory provides an overview of the town’s emissions in 2022, benchmarking them against the previous 2018 report. Notable progress was made during that time; Harvard has demonstrated leadership in the adoption of heat pumps, EVs and solar installations. Our tree cover and land preservation plays a significant role in offsetting our emissions but emissions from transportation and housing challenges remain. Scroll down to see our progress through 2025.
Executive Summary
Harvard is a small town of 6,800 people1 living in about 2,000 households in Worcester County. The town hosts around 180 businesses employing an average of 2,300 workers. To complete this inventory, we utilized the Metropolitan Area Planning Council’s (MAPC’s) Community Greenhouse Gas Inventory Tool Version 6.03. In 2022, activity within Harvard resulted in 43,499 metric tons of carbon dioxide equivalent (MTCO2e), or about 6.3 MT CO2e per person. Approximately half of all greenhouse gas (GHG) emissions come from transportation, making it the biggest source of emissions. In this category, passenger cars account for more than 92% of transportation-related emissions. Buildings (aka stationary energy) make up about 47% of emissions in Harvard with residential buildings making up the largest source (59%). Emissions from solid waste and wastewater make up the remainder. Figure 1 shows the breakdown of emissions by sector.
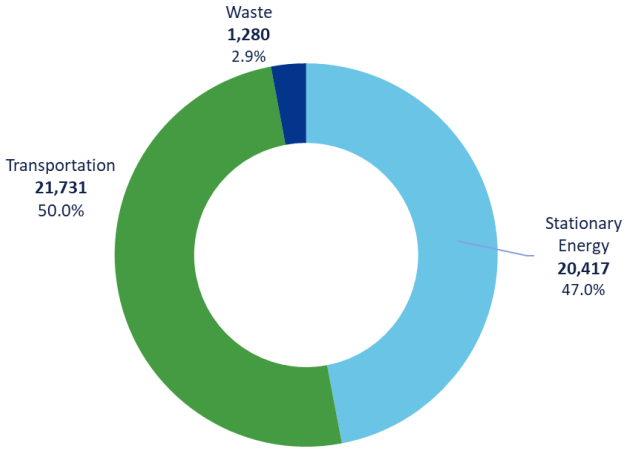
2022 Community-wide Emissions (MT CO2e) by Sector in Harvard, MA
Compared to the 2018 inventory, emissions in this 2022 estimate are lower though the methods between the two estimates differ. Two key differences lead to reduced emissions in the 2022 estimate. First, emissions from electricity have declined over time, reducing emissions from buildings. Second, the 2022 estimate of vehicle miles traveled is 15% lower than the estimate used in the 2018 inventory. Additional differences in assumptions may contribute to the significant decline in transportation emissions. Many other categories analyzed in both inventories suggest small declines.
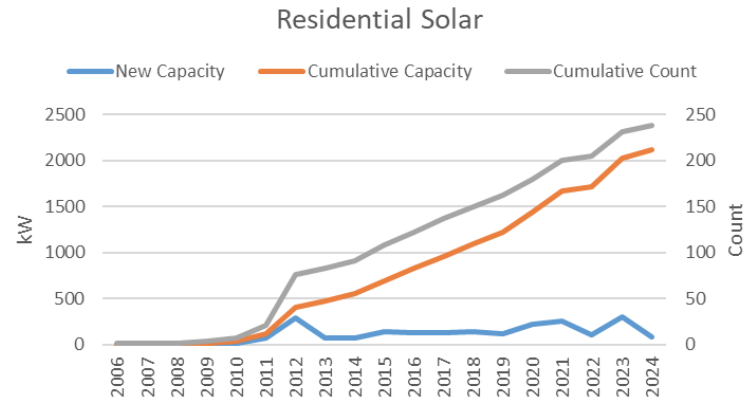
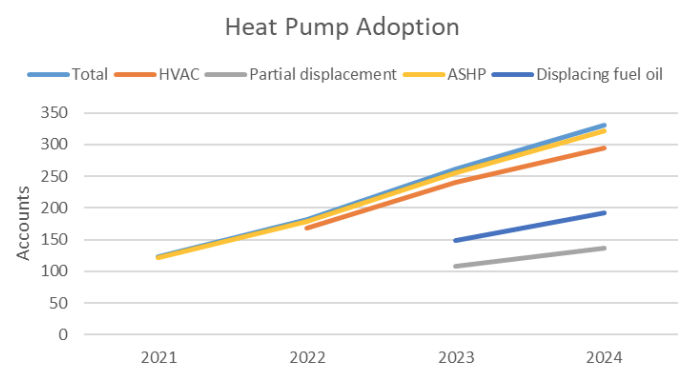
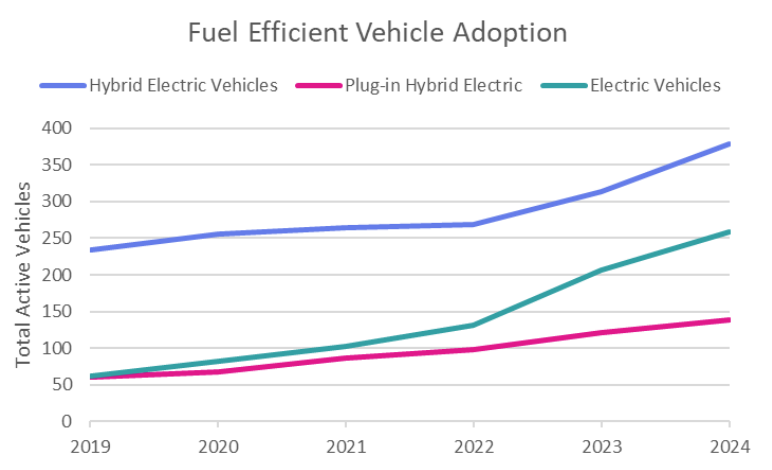
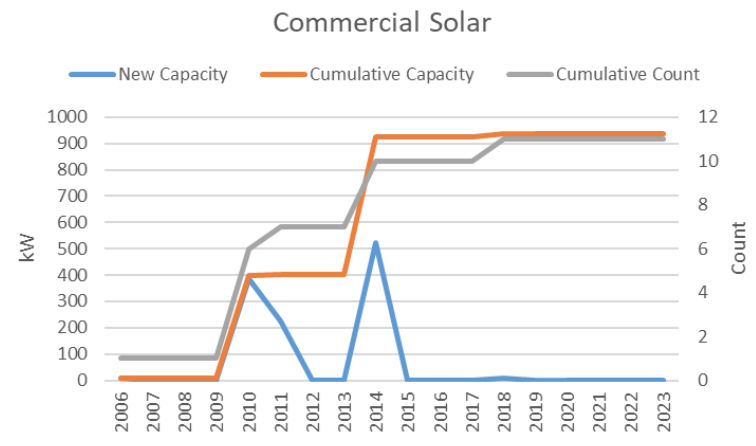
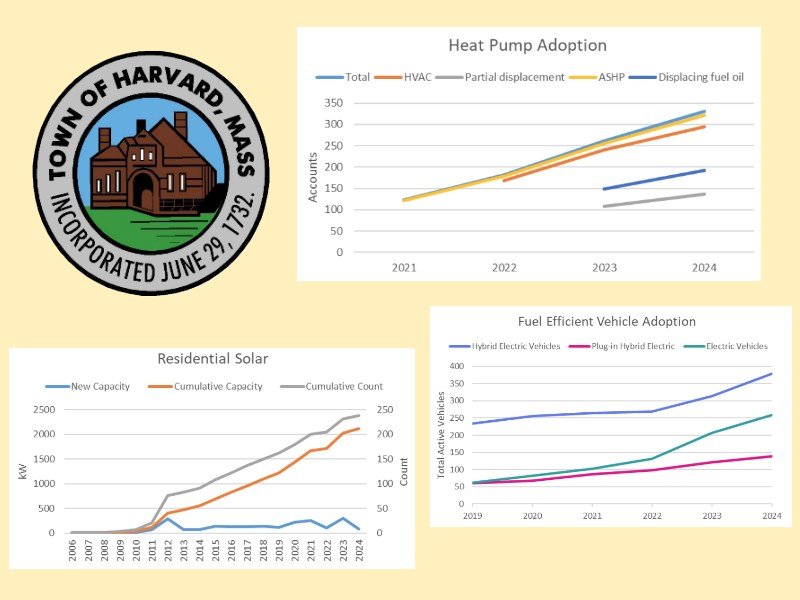
Residential participation in Harvard’s Community Choice Power Supply Program is high at about 78% of all electricity purchases and most participants are enrolled in the 100% renewable electricity option. About 25% of commercial electricity used in Harvard is also purchased through the program. This significantly reduces the emissions from electricity in Harvard. According to data from the Mass Save program, there are 330 accounts as of the end of 2024 with heat pumps, equivalent to about 15% of housing units. As of the end of 2023, Harvard had 3.1 MW of solar installed. There was a total of 238 residential solar, roughly equivalent to 11% of households. A total of 250 vehicles or 4.3% of all registered vehicles are battery electric or plug-in hybrid vehicles.
The town’s net GHG emissions are negative if you factor in the carbon removals and storage from the trees, which annually remove about 48 kilotons of CO2e, more than the GHG emissions of all other activity in the town.