Harvard's Climate Initiative
COMMIT > ACT > THRIVE
Progress
Local and State
Harvard and MassachusettsThe first graph illustrates the cumulative number of solar installations by Harvard residents and businesses. This does not include the approximately 60 residents and businesses who purchased a share of the community solar project on Ayer Road. For heat pumps, the graph illustrates the cumulative number of homes that installed air source or ground source heat pumps.
The graph below shows the current progress in Harvard versus the 2030 Massachusetts Goals. They represent the percentage of Households that have installed a Heat Pump and the percentage of Harvard resident owned cars that are Electric or Electric-Hybrid plug-ins. Please note that the data underrepresents the number of households with heat pumps as Town of Harvard electrical permit data specifically for heat pumps was not captured prior to 2020. Some data was available from two installers who were part of the town’s Heatsmart program sponsored by the state in 2018-2019.
National
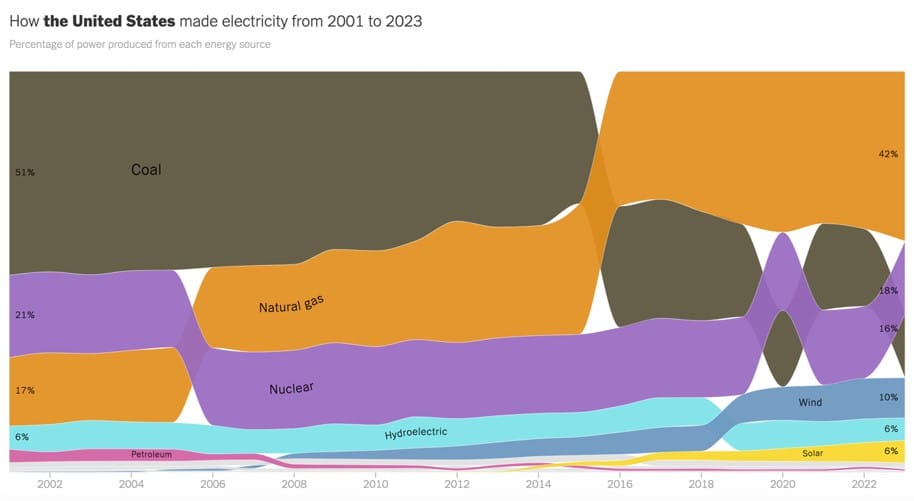
Here are good sources where you will find more detailed information about United States Climate Change:
Global
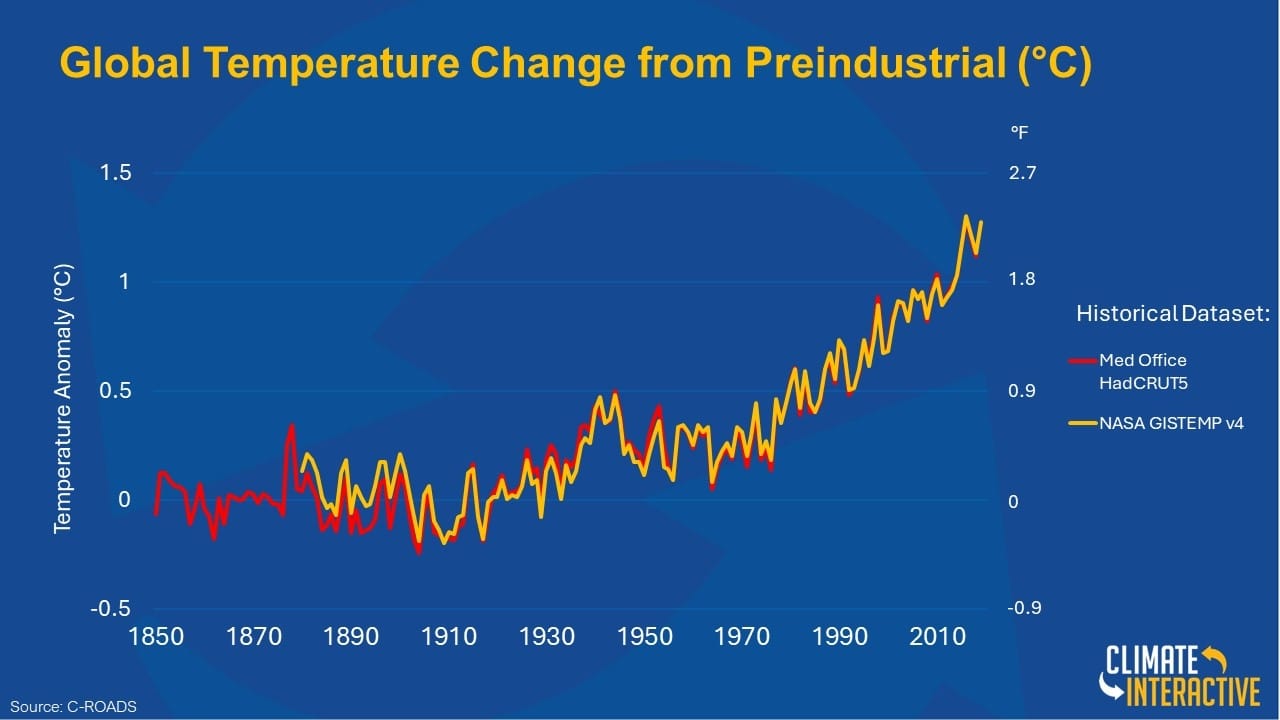
Here are good sources of information about Global Climate Change:
World Bank Global Development Data


